Validate additive-manufactured components with CT part-to-CAD analysis. Compare printed parts to nominal CAD, measure dimensional deviation, and support design verification non-destructively.
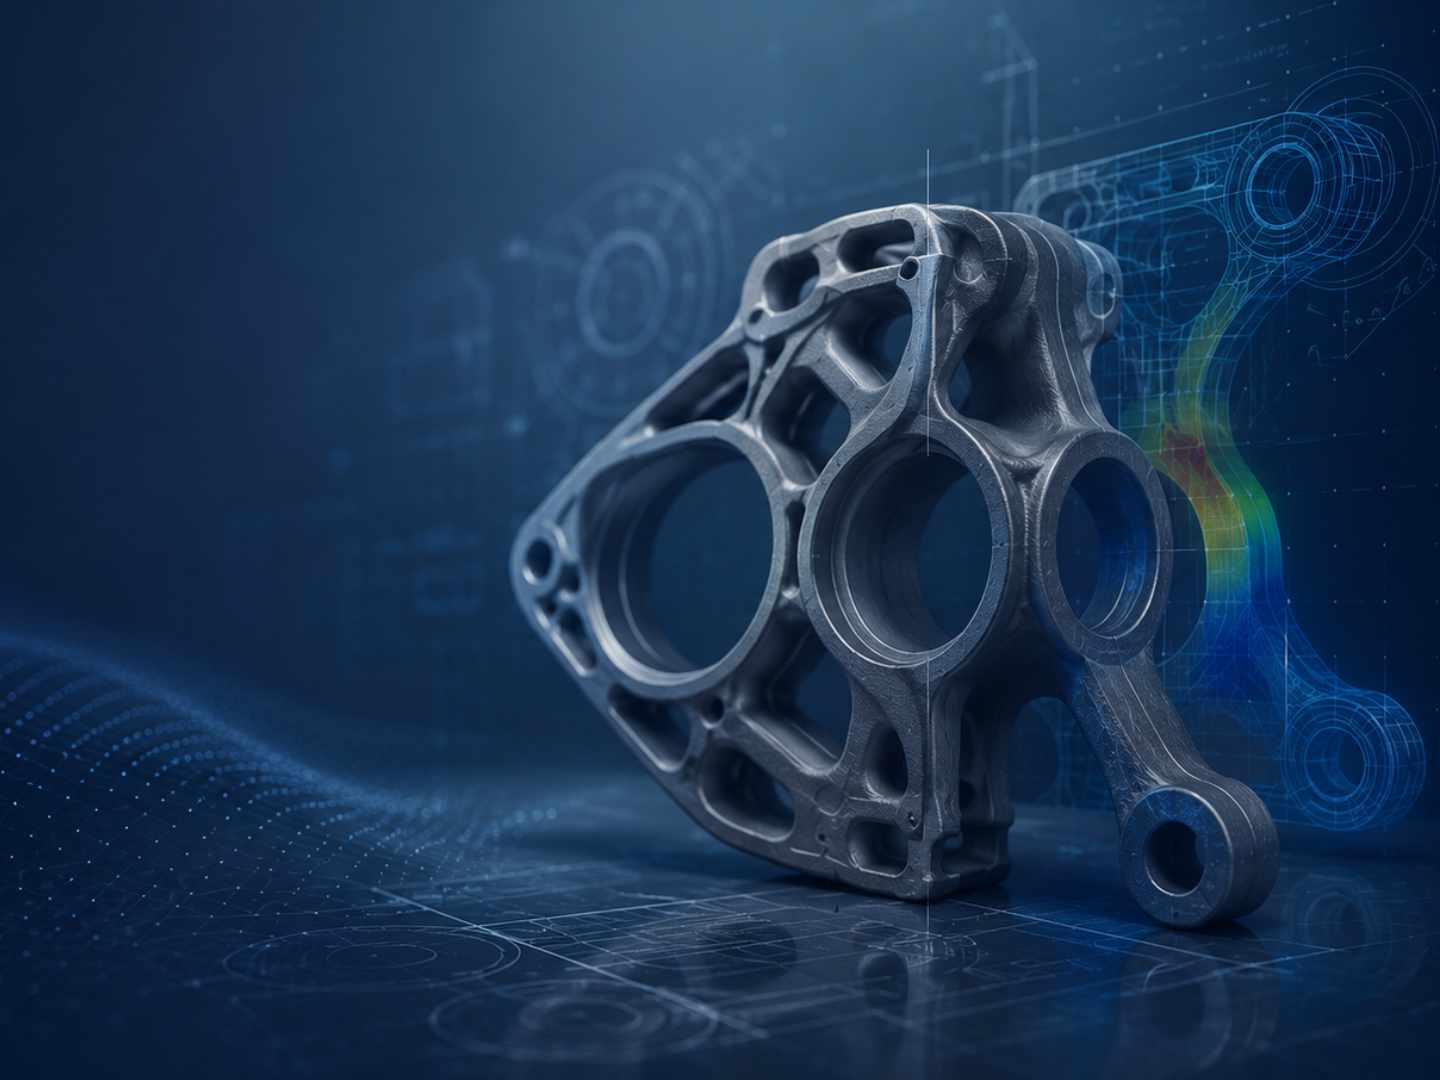
Additive manufacturing has changed what engineers can design.
Complex internal structures, topology-optimized geometries, lightweight lattice designs, and consolidated assemblies that were once difficult or impossible to manufacture are now becoming production realities.
But as additive manufacturing moves beyond prototyping and into production applications, a new challenge emerges:
A CAD model represents design intent. It defines the nominal geometry, critical features, dimensional relationships, and functional requirements of a component.
The manufactured part represents the result of a real-world process.
Between those two points exists everything that happens during production: material behavior, thermal effects, process variation, and manufacturing influences that can affect the final geometry.
For additive manufacturing teams, the question is no longer simply:
“Can we print this component?”
The more important question becomes:
“How closely does the manufactured component match the design it was intended to become?”
This is where CT part-to-CAD analysis provides a critical advantage.
By comparing a complete 3D CT dataset against the nominal CAD model, engineers can evaluate the relationship between the digital design and the physical component—providing a more complete understanding of dimensional variation, geometric accuracy, and manufacturing results.
Every manufactured part begins as a digital definition.
The CAD model establishes:
However, the physical manufacturing process introduces variables that do not exist in the digital environment.
Even well-controlled additive manufacturing processes can produce differences between CAD and the final component due to:
For simple geometries, traditional inspection methods can often verify whether critical dimensions meet requirements.
For complex additive components, the challenge is different.
Many of the most important characteristics are not isolated dimensions. They are relationships between multiple surfaces, features, and internal regions that work together as a complete geometry.
Understanding those relationships requires more than measuring individual points.
It requires comparing the manufactured component to the original CAD model as a whole.
CT part-to-CAD analysis is the process of comparing a scanned component against its nominal CAD model to identify differences between the intended design and the manufactured result.
Unlike traditional inspection methods that evaluate selected features or measurement locations, CT captures a complete volumetric representation of the part. For components with complex internal structures or inaccessible geometries, this volumetric view is one of the primary reasons CT has become such a valuable inspection method for additive manufacturing.
That data allows engineers to evaluate:
The goal is not simply to create a visual comparison.
The goal is to generate meaningful engineering information that helps answer:
Did the manufactured component achieve the intended design?
One of the most important—and often overlooked—steps in any part-to-CAD comparison is alignment.
Before deviation can be measured, the CT dataset must be positioned relative to the CAD model using an alignment strategy appropriate for the inspection objective.
Different alignment methods answer different engineering questions.
Best-fit alignment minimizes overall deviation between the scanned component and CAD geometry.
This approach can be useful when evaluating overall shape agreement or understanding general manufacturing variation.
However, it may not always represent how the component functions in an assembly or how it is defined on an engineering drawing.
Datum-based alignment uses the same functional references defined by the engineering drawing or inspection plan.
This approach is often preferred when evaluating:
It provides insight into how the manufactured part compares to the design based on the same reference framework used during engineering evaluation.
Feature-based alignment uses selected geometry to establish the comparison relationship.
This can be valuable when investigating specific regions of interest or understanding how a critical feature compares to nominal.
The key takeaway:
A part-to-CAD comparison is only as meaningful as the alignment strategy behind it.
Proper alignment ensures that deviation results reflect an engineering question—not simply a software calculation.
Traditional inspection often focuses on confirming whether specific dimensions meet tolerance requirements.
That remains an important part of manufacturing quality.
However, additive manufacturing often creates situations where the complete geometry matters more than individual measurements.
A component may contain subtle dimensional shifts across multiple areas that are difficult to identify through isolated inspection points.
CT-based part-to-CAD analysis enables full-field comparison across the entire component.
Deviation maps can reveal:
This provides engineers with information that a simple pass/fail measurement report cannot.
Instead of only asking:
“Is this dimension within tolerance?”
Teams can investigate:
“How does the entire manufactured component compare to the intended design?”
As additive manufacturing enters regulated and production environments, manufacturers need more than confidence that a part can be produced.
They need evidence that the manufactured component meets engineering requirements.
CT part-to-CAD analysis can support:
During initial production, engineers need to confirm that the printed component reflects the released design.
A complete CAD comparison provides insight into overall dimensional accuracy and identifies areas requiring further review.
For new additive designs, CT comparison helps determine whether the physical component represents the intended geometry before moving into additional testing or production stages.
When additive components are produced by different suppliers or manufacturing processes, part-to-CAD analysis can help compare output consistency against the same nominal design.
As additive programs mature, recurring dimensional trends can be monitored to evaluate manufacturing stability and repeatability.
The greatest value of CT part-to-CAD analysis is not the scan itself.
It is the ability to make better engineering decisions using a more complete understanding of the manufactured component.
CT comparison can help answer questions such as:
These questions move inspection beyond measurement collection. They turn inspection data into actionable engineering knowledge. In some additive manufacturing workflows, that same CT data can also be used upstream to identify recurring dimensional trends, correlate variation to build behavior, and support process refinement over time.
The continued growth of additive manufacturing depends on confidence.
Manufacturers must demonstrate that complex components can be produced consistently, accurately, and according to engineering requirements.
That requires inspection methods capable of evaluating the complexity that makes additive manufacturing valuable in the first place.
CT part-to-CAD analysis provides that capability by connecting three critical elements:
Digital design → Manufacturing process → Physical component
It gives engineers a clearer understanding of what was designed, what was built, and how closely those two realities align.
Because in additive manufacturing, success is not defined only by whether a part can be printed.
Success is defined by whether the printed component performs as the engineer intended.
At Nel PreTech Corporation, industrial CT scanning is used as an engineering tool—not simply an imaging technology.
Our team helps manufacturers evaluate complex components by combining CT data, advanced analysis software, and metrology expertise to provide meaningful insight into manufactured geometry.
CT part-to-CAD analysis services can support:
As an A2LA ISO/IEC 17025 accredited laboratory, Nel PreTech provides inspection solutions designed to help engineers understand not only whether a component meets requirements, but how accurately it represents the original design intent.
CT part-to-CAD analysis compares a scanned manufactured component against its original CAD model to identify dimensional differences between the intended design and the physical part.
CT provides a complete 3D representation of a component, allowing engineers to evaluate the manufactured geometry as a whole rather than relying only on selected measurement points.
A CT comparison can show dimensional deviation, geometric variation, feature location differences, wall thickness changes, and how closely a manufactured component matches nominal CAD.
Yes. CT-based CAD comparison can support first article inspection, design verification, supplier qualification, and production validation activities.
No. CT complements traditional metrology methods. CMMs, optical systems, and vision systems remain valuable for many applications, while CT provides additional volumetric insight for complex geometries.

Greg Nelson is the Operations Manager and co-owner of Nel PreTech Corporation, with 30+ years of experience supporting precision metrology and inspection services. He oversees operational workflows for CMM, industrial CT, and blue light 3D scanning while helping maintain the company’s ISO 17025–accredited quality system. Greg brings decades of hands-on leadership to delivering accurate, reliable inspection results across regulated industries.

You'll find all the detailed service information you need in one brochure.
Download Brochure
Get a quote within 24-hours and keep your project on schedule.
Get a Quote
Our Nel PreTech engineers are ready to get started on your product challenges.
Ask an Engineer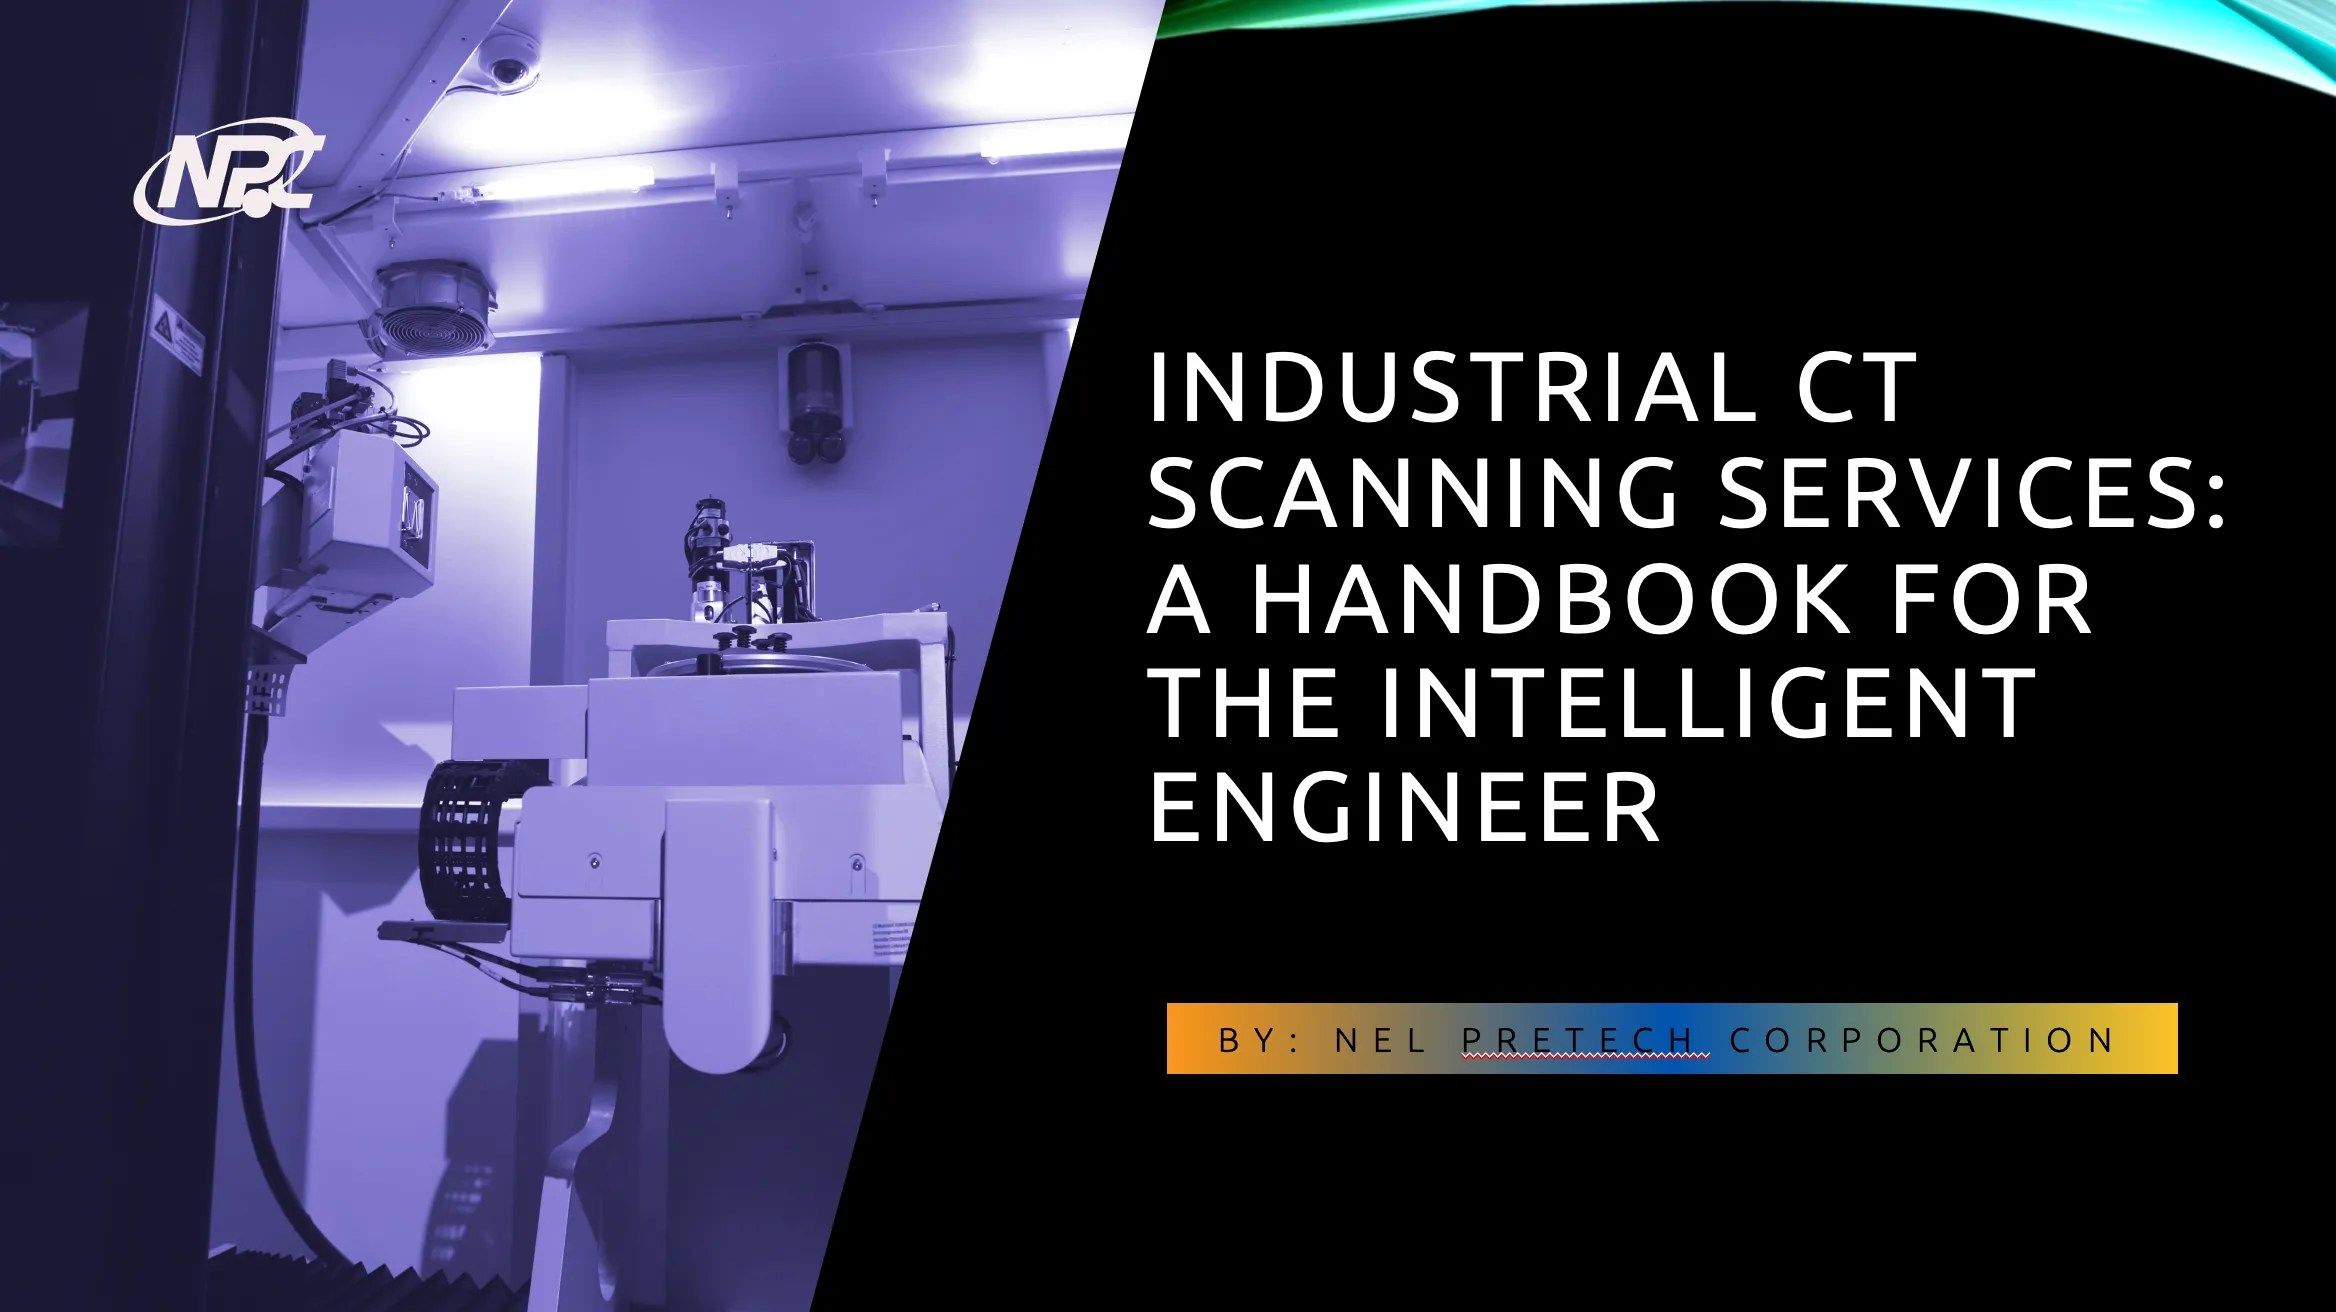
Download the ultimate CT Scanning Buyer's Guide to improve understanding, time, and efficiency in your scanning needs. Over 50 Pages of useful data and case studies.
Download Now