Introduction
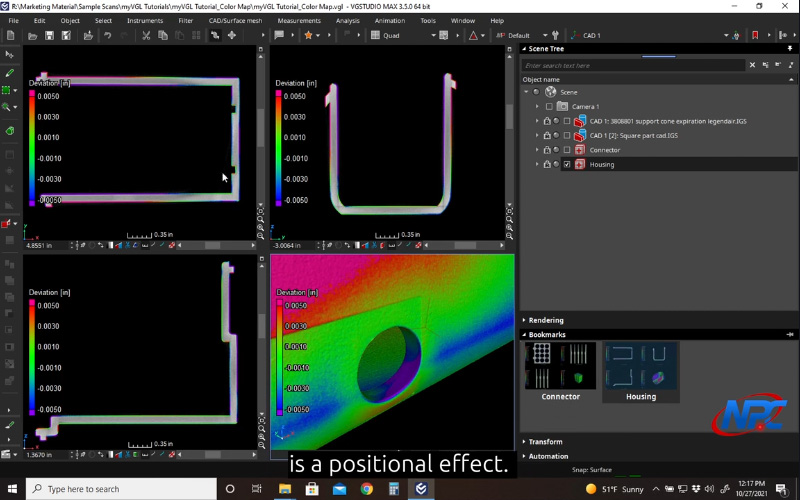
Color maps are one of the most powerful visualization tools in CT analysis—but only when they are interpreted correctly. This tutorial walks users through how to interrogate a color map in the free MyVGL Viewer, moving beyond surface-level visualization to meaningful insight.
Rather than explaining color theory in isolation, the video demonstrates how color maps behave inside an actual CT dataset and how to use them responsibly when reviewing scanned parts.
What This Tutorial Covers
In this video, you’ll learn how to:
- Interrogate density variations using interactive color maps
- Identify meaningful changes versus visualization artifacts
- Adjust viewing parameters to reveal subtle features
- Correlate color transitions with underlying voxel data
The tutorial emphasizes interpretation, not just appearance—showing how color maps support visual analysis without replacing engineering judgment.
Why Color Map Interrogation Matters
CT color maps can quickly highlight:
- Density gradients
- Material inconsistencies
- Internal features that are difficult to see in grayscale
However, improper interpretation can lead to incorrect assumptions. This tutorial explains how to use color maps as a visual aid, not a standalone measurement tool, reinforcing best practices for CT data review.
Built for the Free MyVGL Viewer
All demonstrations are performed using the free MyVGL Viewer provided to customers. While advanced analysis tools exist in the full MyVGL platform, this tutorial equips users to:
- Confidently review delivered CT datasets
- Communicate findings visually
- Ask better, more informed technical questions
The focus remains on extracting value from the Viewer without overstating its analytical scope.
Why the Video Is Essential
Color map behavior is dynamic and context-dependent. The video shows:
- Real-time adjustments and their effects
- How color ranges shift perception
- Where users commonly misinterpret results
These nuances are difficult to convey through text alone. Watching the tutorial ensures viewers understand how and why color maps change—not just what they are.
Watch Full TutorialFor additional MyVGL Viewer tutorials, visit:
https://www.nelpretech.com/myvgl-tutorials